

1st September 2025 River Deben Environment Monitoring Results
- Deben Climate Centre

- Sep 9, 2025
- 3 min read
Updated: Nov 7, 2025
Our water samplers and testers were out again across the Deben catchment at the beginning of September. The past days have seen bursts of heavy rain mainly showers rather than longer periods on rain. These have resulted in a rise in river flow and a small rise in river levels in some areas. Our Debenham Green Team group did find 7 out of their 16 sampling locations dry although by contrast the tidal section had significant runoff and CSO spill activity.
Here’s an update on the bacterial pollution incident on the tidal section in Woodbridge and Melton and the other results from the rest of the Deben catchment.
1. E.coli and bacterial pollution alert
From the 1st-4th September we saw a series of pollution incidents around the Woodbridge/Melton area from Anglian Water Combined Sewer Overflows after the heavy rain. The results were shocking, with almost all sites sampled showing E.coli levels significantly above the safe bathing limit of 9ml, and at one site near the Woodbridge Marina we found over 1000 colonies per 1ml!

Outside of these incidents, E.coli levels at Debenham and on the Rivers Lark and Fynn were much higher than in previous months.The River Lark numbers are the highest we have recorded since testing started in 2023. By contrast the Brandeston/ Easton to Debenham section was stable with quite low levels of pollution.


It is interesting to note that at Waldringfield - alongside an exhibition “Memories of the Tideline”, our sampling showed elevated E.coli levels on the actual tideline; this may be due to animal related bacteria washed along as the tide comes in.
2. Phosphates
This month's results are broadly similar to those in August with the “red-rated” levels (over 1.0 mg/litre) being almost all at or downstream of Anglian Water STWs that have not had phosphate removal installed. The exception is at Wickham Market where, from an explanation received from Anglian Water, the local team are trying to balance the impact of phosphate stripping with effective microbiological treatment. The level here is only just over the permitted Environment Agency target. The key hotspots are at Easton and on the Lark/ Fynn system at Henley, Grundisburgh and Martlesham Creek.


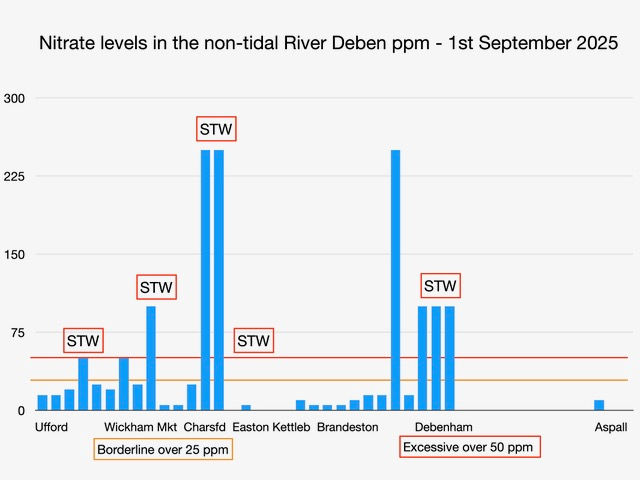
3. Nitrates
Encouraging results from the Fynn/ Lark are suggest that nitrate levels have fallen significantly in the past month. This appears surprising given the big E.coli increase. Some of this may be due to greater flow following recent rain which has yet to leach out nitrate held in farm ditches.
For the Deben, nitrate levels are broadly similar to those in August. If current weather patterns persist with more rain, then we would expect nitrate levels to rise in the coming months and rain leaches out trapped chemicals.

4. Deben Flow Rate
New data from the Naunton Hall measuring station near Rendlesham allows us to track river flow rates in the non-tidal section. With acknowledgements to the Environment Agency and to the landowner, here is the flow rate trend for the past 6 months.

This shows the decline in river flow over the summer months (greater than in several previous years) alongside spikes in mid-June and mid-July with a steady increase in the past weeks. The dotted line results have yet to be confirmed but we would expect rainfall in the coming weeks to increase flow. We are exploring sources of rainfall historical data to add to this emerging picture.


Comments