

7th April 2026 River Deben Environment Monitoring Results
- Deben Climate Centre

- Apr 13
- 3 min read
Last week our volunteers sampled and tested water from nearly 70 locations across the Deben catchment in sunny and warm weather. River levels are currently relatively low for the time of year with there having been little rain for some weeks.
1. E.coli
Levels of bacterial pollution are down on previous months across almost all sampling points. In some areas we found low levels of E.coli not seen for over 24 months.
Samples taken at Anglian Water STW outfalls continue to be high, notably at Debenham, Wickham Market, Henley, Tuddenham and Martlesham Creek. By contrast, there was almost no presence of E.coli pollution in the section from Framsden down to Easton and in the tidal section from Melton/ Woodbridge to Bawdsey.
The Deben map shows only 12 out of more than 50 samples with elevated E.coli.
Similarly at Debenham, only the STW and its downstream sample were high; it is also notable that two sampling points were dry - surprising so early in the year.


2. Phosphate
Levels of phosphate pollution were also lower than in previous months across the catchment, showing a similar pattern to the E.coli results. The exception was on the River Fynn where levels are similar to previous months. As with E.coli, the section from below Debenham down to Easton shows almost no phosphate presence.
At Rendlesham STW, in spite of Anglian Water's work to install phosphate removal technology, levels have actually increased this month; the commissioning appears to be slower than we had hoped. At Wickham Market STW the level is still above the EA permitted 1mg/litre, showing their continued problems with balancing chemical and. biological processes.
In the Debenham area, phosphate levels are all low with the highest sample at 0.18 mg/litre just below the STW; this is well within the 0.5 mg/litre EA permit.


3. Nitrate
Here again, levels of nitrate pollution look to be lower than in previous months, possibly due to retained nitrate being washed out during winter rains. Apart from a few STW samples, all the nitrate readings are at or below the 50 ppm excessive target.


4. Ammonia
We have changed our ammonia testing protocol to avoid use of toxic reagents which have traces of mercury. This has meant a slightly less accurate set of results but has allowed us to study the whole catchment.
Using a challenging 0.5 ppm target, the Deben non-tidal results show very few higher readings. These are largely confined to the Anglian Water STW outfalls. Notably that at Charsfield shows a very high downstream ammonia level, largely due to there being very little water coming from upstream.
On the Lark/Fynn, the ammonia levels are not a major concern either; the spike at the Fynn Sluice may well be due to tidal inflow from Martlesham Creek STW where the ammonia output was in the range of 3.5 to 6 ppm.


5. Other News: DeCC and the Ufford breach
We are planning to start weekend water testing demonstration sessions for the public at the DeCC in the coming months.
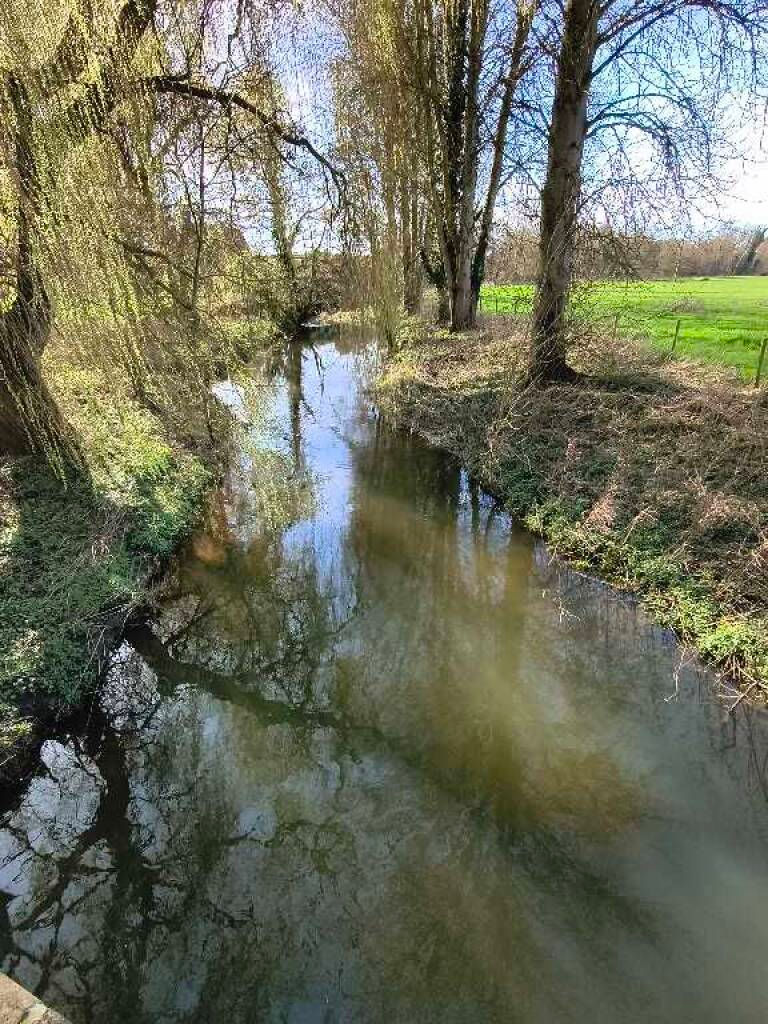
The large breach at the Ufford weir is having a major impact locally; river levels have dropped by almost one metre. This has left the mill stream channel to dry out with a loss of fish and aquatic species. This photo shows the Riverfly sampling site now; before the breach waders were needed to do sampling and this area was alive with caddis and mayfly larvae as well as roach, dace and small trout.


Comments