

3rd August 2026 River Deben Environment Monitoring Results

Updated: Aug 26

Another month has passed with almost no rainfall in Suffolk and for most of the rest of the East Anglia. An official drought was declared in July and river levels are at the lowest levels that many people can remember. Farmers are faced with almost empty reservoirs and abstraction restrictions; our sampling on Monday 3rd August showed more dry sections in the Deben catchment than we have ever seen. In spite of this situation, Deben water quality has held up in most areas.
1. E.coli
Notwithstanding the very low levels of river flow and lack of rainfall, E.coli pollution in the catchment is lower this month than in July and in several previous months. Outside the areas close to Anglian Water STWs this is probably due to two factors - bright sunshine almost every day killing off bacteria combined with no rain and so no run-off from ditches.
Notable exceptions to the trend include:-
In the tidal section around Woodbridge, the early and mid July E.coli spikes have not been repeated with E.coli levels much lower in many areas. Waldringfield however is now showing E.coli well above "safe bathing" for the third month in a row; this contrasts with Environment Agency findings which appear to show no E.coli presence over the same period.
At Kirton STW and at the small stream coming out at Falkenham Creek, we have recorded extremely high E.coli with Kirton STW at over 300,000 colonies per 100ml and Falkenham Creek at 30,000 colonies per 100ml. The latter is in the tidal section and both have been reported to Anglian Water and the Environment Agency for investigation.
E.coli at some of the Fynn and Lark sites is still very high whilst others are much lower; the latter probably due to constant daytime sunshine killing off the bacteria. However, our sampling teams are discovering new sources in some small streams there.
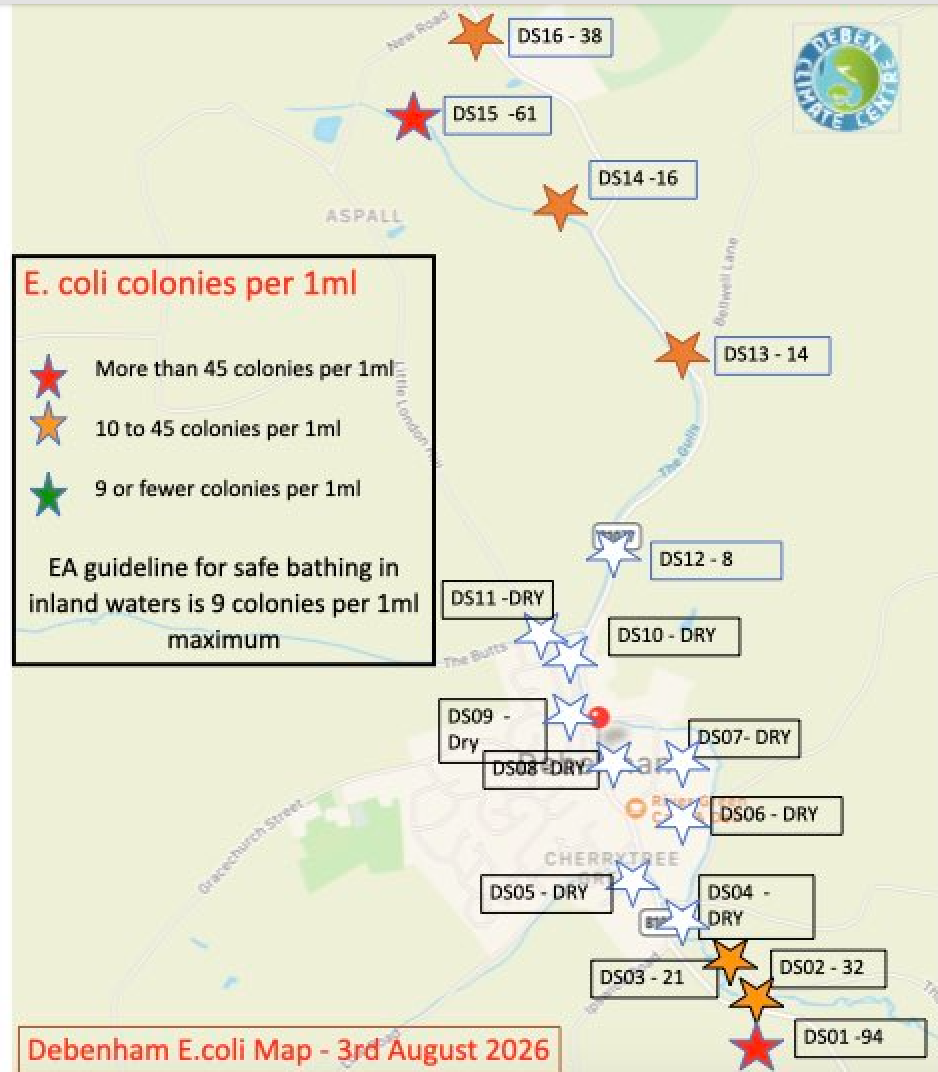
At Debenham 9 of the 16 sampling sites were completely dry; there is very little flow at any of the remaining sites in this area.

2. Phosphate
For many sections of the Deben phosphate levels remain lower than in previous months even though our sampling teams observed many cases where filamentous algal is present, coating weed and river gravel with a brown/ green slimy deposits. Our analysis identified two areas of significant concern on phosphate:-
At the Charsfield STW, the Phosphate as P level was 4.79 mg/litre with only a slightly lower level 100 metres downstream. This figure is above the 4.0 mg/litre STW permit limit set by the Environment Agency, which in itself is higher than for all the other STWs equipped with phosphate removal kit. Previous levels have been between 0.5 and 1.5 mgf/ litre, so the results suggest that the phosphate removal operation is out of balance, reflecting a similar problem experienced at Wickham Market earlier in the year. Both AW and EA have been notified.
At Kirton STW, phosphate levels remain very high - close to 100 times the "healthy river" guideline - with tidal section impact also noted at Falkenham Creek. There is no phosphate removal installation at Kirton and there must be a case for investment here as there is at the smaller STWs in the Fynn and Lark sections. Neither of these are included in the Anglian Water investment plan AMP 25 -30.
By contrast, it is encouraging to see the Rendlesham STW phosphate level well within the new EA permit 1.0 mg/ml level for the second month after its early June commissioning.


3. Nitrate Pollution
The presence of high nitrate in rivers, when combined with excess phosphate leads to algal and weed growth, as noted above with the presence of filamentous algae in the non-tidal river and green weed, reported by boat owners in the estuary.
Although nitrate levels have been fairly stable in the non-tidal Deben for around three months, they are still higher in several places than the WFD guideline of less than 25 mg/litre (note that US standards are much lower). In the Deben catchment our dipstick tests show a massive difference between the AW outfalls with around 100 to 500 mg/ litre and fast flowing sections where nitrates are around 10 mg/litre.
It would seem that with no rain, any nitrate pollution is either residual or coming from AW STWs; there has been minimal run-off from agricultural land since early July when we had localised thunderstorms.
4. Ammonia
It is good to report that, with the exception of Kirton and Martlesham Creek STW outfalls, there were very few sites with any appreciable levels of ammonia pollution (over 1 mg/litre) recorded this month. The Kirton ammonia spike is associated with its very high E.coli finding and has been reported to Anglian Water and the Environment Agency.


Comments