

7th September 2026 River Deben Environment Monitoring Results

We completed our sampling and testing for almost 80 locations across the Deben catchment earlier this week. The weather in August and early September has continued to be warm and dry; only in recent days has there been any appreciable rainfall. This is reflected in continued low river levels, slow flow and dry sites (the latter notably in the Debenham area).
1. E.coli pollution
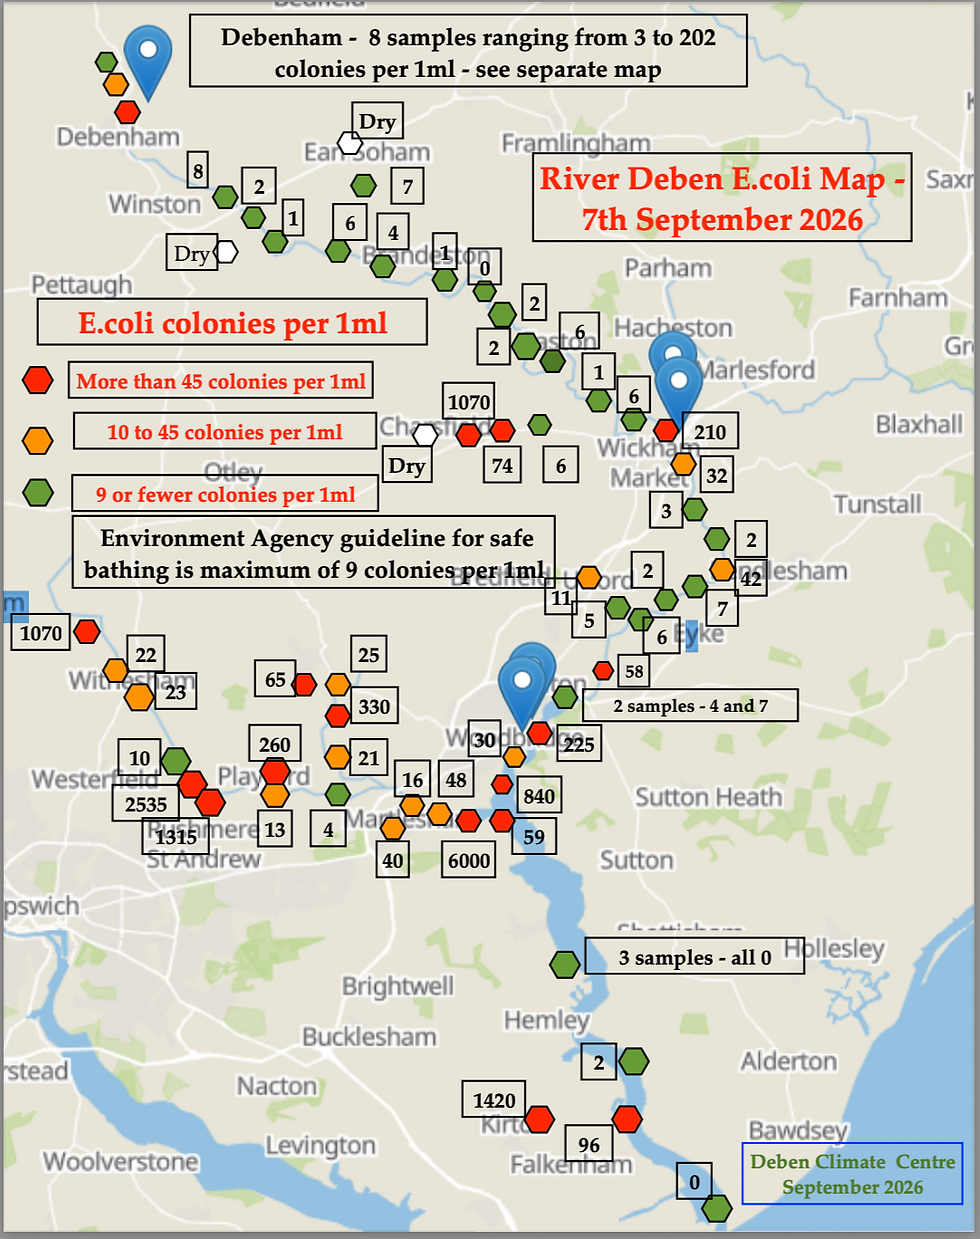
Results in many non-tidal locations on the River Deben, below Debenham, are similar or lower than in previous months. With the exception of the Charsfield and Wickham Market STW's and their downstream sampling sites, the levels of bacterial pollution are minimal especially above Easton. By contrast the Fynn/Lark tributary shows much higher levels of E.coli than in previous months at many locations; these may be due to low flow but also the high readings coming from Anglian Water STW outfalls.
Debenham continues to see low flow and many dry sites; this lack of flow coupled with some rainfall wetting others has resulted in a surge in the number of high E.coli sites by comparison with July and August.
Looking at the tidal section, we recorded some of the worst ever E.coli results in the Woodbridge area. The map shows a succession of unsafe bathing areas from the Tide Mill to Kyson Point/ Martlesham Creek. The sample from Deben Yacht Club at 840 colonies per 1ml was almost 100 times the EA "safe bathing limit" - this on a day with no rain when water users were out on the river. See E.coli plates for the Woodbridge to Melton tidal area below. Environment Agency and Anglian Water were advised as soon as these results became known and have been asked to investigate.
Further down the river, below Waldringfield (which was clean - no E.coli from any of the three samples), there was a second pollution incident opposite Ramsholt on 31st August when we sampled; This appears to be associated with either the Kirton STW or from a malfunctioning pumping unit; EA and AW have been informed and are investigating this issue now.


2. Phosphate
There has been a slight increase in phosphate nutrient pollution levels across the catchment this month, most likely associated with a combination of low flow and limited rainfall flushing some ditches. The usual hotspots are at and below Anglian Water STW's, where there is no PO4 stripper installed; notably at Henley, Tuddenham, Martlesham Creek and Kirton. The Charsfield STW appears to be having continuing problems in meeting its target PO4 output but our samplers reported that an AW employee at the treatment works told them that an alternative chemical was going to be used at this problem works.
We will continue to push Anglian Water to install PO4 stripping at the high pollution treatment works.
By contrast, Debenham phosphate levels remain stable and not too far away from "healthy river" targets even though low water flow contributed to higher nutrient concentrations.


3. Nitrate pollution
Levels of nitrate pollution are still relatively low for this time of year; we think this is largely due to the lengthy period with minimal rainfall and hence very low run-off from fields, ditches and highways. The spikes in nitrate are all associated with known Anglian Water STW outfalls.
4. Ammonia pollution
Our ammonia testing has reverted to use of the Hanna Ammonia MR kit at selected sites in several of the sections covered; Debenham and the Fynn/Lark still test most of their samples. In other sections, tests are often only done where there is evidence or a history of high E.coli presence.
The stand-out ammonia issue this month is at Kyson Point where higher than trend E.coli (59 colonies per 1ml) was combined with an extremely high ammonia reading at 6.38 mg/litre. Given that this sample was taken at or close to high tide, this is a very worrying result with public health implications. It was immediately reported to the Environment Agency and to Anglian Water and we are awaiting a response.


Comments