

5th January 2026 River Deben Environment Monitoring Results
- Deben Climate Centre

- Jan 13
- 4 min read

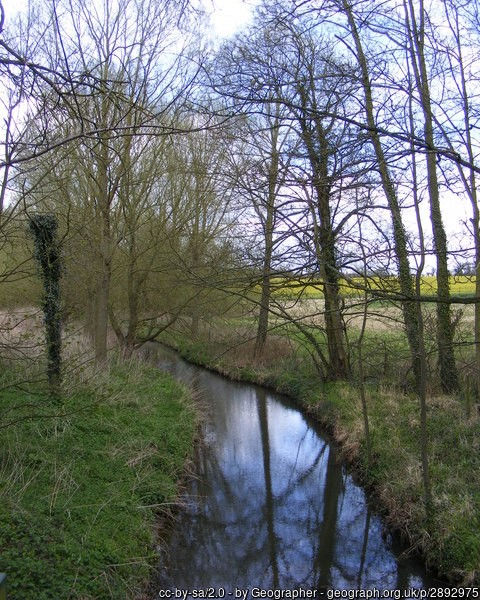
Happy new year from our Water Testing Team and thank you to all of our volunteers who turned out on a snowy and cold Monday 5th to take samples. We had much lower water temperatures (lowest was 0.3C) than usual at this time of year and this also resulted in the water at several sampling points being frozen over - these were mostly in the narrow sections at Debenham.
Special mention must also be made of two concerning test results which have been shared with Anglian Water and the Environment Agency already:
At Charsfield STW we found E.coli at 2000 plus colonies per 1ml and Ammonia at around 18 ppm (around 30 times the Water Framework Directive danger threshold). At the moment, the STW is almost the sole source of water in Charsfield Brook, so there is a significant risk to animal, aquatic and plant life.
The other concerning result is at the Wickham Market STW where Phosphate as P is 1.24 mg/ litre, higher than the WM permitted level of 1.0 mg/litre. This is particularly worrying as, after higher than permit levels in late summer, Anglian Water technical experts had worked to rebalance the phosphate stripping plant.
1. E.coli
The January results are broadly in line with recent trends with low E.coli levels in large sections of the non-tidal Deben, especially away from the impact of the outfalls from Anglian Water STW’s. Apart from Charsfield, the STW’s at Debenham, Wickham Market, Martlesham Creek and at Henley and Tuddenham on the River Fynn all show high E.coli readings. One surprise is the very low level of E.coli at the Rendlesham STW outfall - less than the surrounding sampling points for the first time since we started sampling there over 2 years ago.
There were no appreciable E.coli readings in the tidal section around Woodbridge Tide Mill although Wilford Bridge and Lime Kiln Quay was again higher than its upstream and down-tide neighbours. We are aware that there are several domestic and small business outfalls which flow into the tidal Deben near both so these need following up. As in previous months, Kyson Point saw an E.coli spike almost certainly from the Martlesham STW outfall; the conclusion has to be that it is clearly unsafe for water users in the Creek even at high tide.
We are concerned that the Martlesham Creek works is expected to take more waste water from developments underway at Brightwell Lakes and potentially at Foxhall Road. Anglian Water have included this STW in their WINEP investigations and plans, but there is almost certainly insufficient capacity to support two more large housing estates. Anglian Water are also looking at the possibility of E.coli tertiary treatment here - something that the Deben Climate Centre have been promoting for the past 4 years.
At Debenham, we were only able to collect 6 samples as the river was frozen over in many places. E.coli at and below the Debenham STW were significant this month after low readings in the previous 2 months.


2. Phosphate
As in previous months, the impact of Anglian Water’s phosphate stripping investment continues to show in large sections of the non-tidal Deben above Wickham Market. The whole section of the Deben from Debenham to Glavering Bridge showed levels within the “healthy river” 0.10 mg/litre target. Rendlesham continues to be the outlier at 4.57 mg/litre but we gather that they are gearing up to implement phosphate removal very soon; the river below Rendlesham shows the impact of this STW all the way through to the tidal section at Woodbridge. Here agricultural run-off and water meadow saturation probably both have an impact.
By contrast, the River Fynn/ Lark continues to show high phosphate levels with the Henley and Martlesham Creek STW’s being the chief culprits. That said, phosphate levels here are lower along these two rivers than in previous months.


3. Nitrate
In the two previous months, nitrate levels in the Deben catchment increased significantly due to significant rainfall and some localised flooding. After the dry summer and early autumn, agricultural and related run-off were the most likely contributors. For January, river levels have fallen but nitrate readings are continuing to be high with many sampling points well above the borderline 25 ppm level.
The Anglian Water STW’s were also, as usual, major emitters with Charsfield being the highest by some distance at 500 ppm - more that 20 times the borderline danger level.
There was also an impact on the tidal section with all the samplings points in Woodbridge down to Kyson Point showing at or over the borderline level. This is concerning as samples were taken close to high tide where we would expect very significant tidal dilution to have greater impact.
For the Fynn and Lark catchment, nitrate levels were lower in the River Lark than in recent months although those in the River Fynn were similar to those in December. Interestingly, the impact of the Anglian Water STW’s is much lower here possibly due to the treatment works being smaller than many of those on the Deben.


4. Ammonia
We have continued to expand our ammonia testing this past month; the most significant emitters are the Anglian Water STW’s although levels vary considerably. The Water Framework Directive suggests that ammonia levels in UK rivers are expected to be in the 0.3 to 0.6 mg/litre range to warrant “good ecological status”; it is pleasing to report that much of the Deben - outside of the STW’s - is within this range.
Results from the Rivers Lark and Fynn below illustrate the variation with the Henley and Tuddenham STW’s being spikes with some slight downstream effect.
Looking at other high ammonia results, excluding Charsfield mentioned earlier, the outfalls at Martlesham - 9.2 mg/litre and Wickham Market - 7.6 mg/litre are both very high whilst Debenham - 0.02 mg/litre - is very low. We will keep these under review as the variation between highest and lowest performers is very significant. This may reflect the efficiency of the specific STW or its potential for capacity overload.


Comments